Thursday, 6 December 2012

Beyond Red: MS Remote Sensing of Landscape

Greatly enjoyed speaking at the Irish Quaternary Association annual symposium on Remote sensing: Applications in Quaternary Science, Archaeology and Landscape Management at the Geological survey of Ireland in Dublin.  Among some outstanding contributions the work of the Geological Survey of Ireland on mapping Quaternary sediments stood out.  The draft digital mapping was of exceptional quality and the maps themselves highly effective cartography.  GSI make much of their digital data freely available for use via their website, which is an example to all providers of public data.

My own presentation,on work using multispectral and hyperspectral airborne imagery for archaeological prospection and mapping is on slideshare and available below.

Saturday, 6 October 2012

Mind Maps

I remember first coming across the idea of mental maps, maps that reflect how we perceive and negotiate the environment around us, rather than reflect real space or concrete spatial relationships as a geography undergraduate.  I like this TED talk by graphic designer and cartographer Aris Venetikidis that elegantly describes how we mentally process space and movement through it and applies these concepts to the chaotic muddle of public transport in Dublin,  The results are elegant, meaningful visualizations of movement through the real and mental space of Dublin.  Impressive.

Tuesday, 11 September 2012

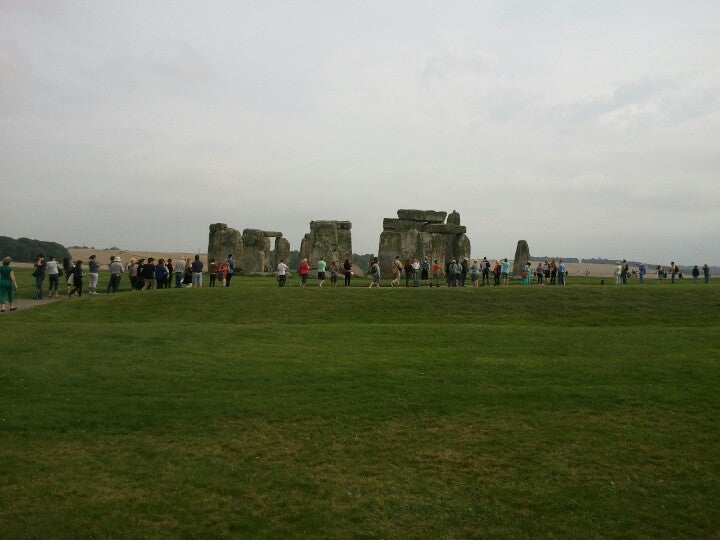
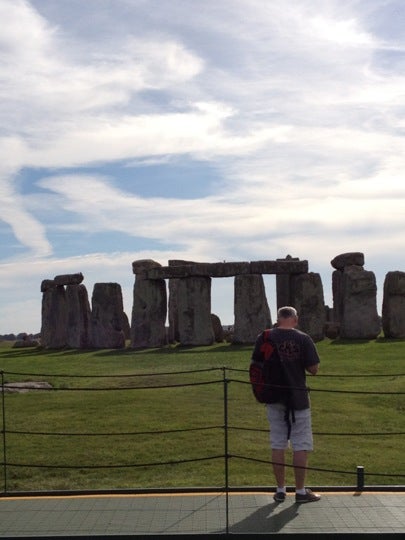
Found some stones in a field: A day of Stonehenge

September 11th 2012, one day at Stonehenge, one day of visitors, one day of tweeted pictures.  Found some stones in a field, definitely made by aliens...

Monday, 20 August 2012

Tweeting the Past

Not so very long ago capture and analysis of the live stream of geolocated tweets using Twitters streaming API was at the cutting edge of social science research. Caught up in the wow of it all we (at Vista) built an application to capture the live stream and after a 50 day proving run had ourselves 1.87 million tweets to analyse.  

50 days, 1.87 million geolocated tweets for the British Isles

Much of the analysis of twitter data has tended to focus on the spatial patters of use or the social networks revealed by the complex interrelationship of users  We we interested primarily on information relation to heritage, what do people tweet about heritage subject, where from, etc.  Results, it has to be admitted, were modest. Over 50 days only 22 tweets mentioning archaeology - including the wonderfully derogatory "goodness me archaeology is boring" (with more than a nod to Armstrong and Miller).  More interesting were spatial patterns of tweets in relation to heritage imbued landscapes, archetypally tweets from Stonehenge, displaying wonder at the monument and often accompanied by tweeter links to pictures.  This is richer fare for the study of reception of the past, and deserved more thought than we gave it at the time.  You can read about our work in the presentation below and in our paper A software system for data mining with twitter Proceedings of 2011, 10th IEEE International Conference on Cybernetic Intelligent Systems, CIS 2011, pp. 139–144, 2011.


And now, barely a year later, everybody is grabbing and mapping the live twitter stream.  Some of the applications are quite impressive, my personal favorite this live map of tweets from the Middle East, greatly revealing of the conflicts in Syria and elsewhere. What is still more astounding is that in the latest iteration of Bing Maps, Microsoft have added the facility to map live tweets against a Bing maps background. So, here, by way of experiment, live maps of all tweets from the Stonehenge area, and all tweets from the UK mentioning "archaeology". Remember, these are live maps and so most tweets will be sent during UK daylight hours  especially from Stonehenge.